Get insights on the latest trading and market trends

    Trading Matters is a series of exclusive webinars and compilation of key highlights that give you the latest market insights

    Trading Highlights

    Stay updated and make more informed trading decisions with A.I. Oscar.

    We recognise that analysing individual stocks across the Singapore, U.S. and Hong Kong markets can be a time-consuming process for traders.

    That is why we created A.I. Oscar – a virtual trading assistant conceived from the mind of an OCBC Securities Trading Strategist and built in collaboration with the OCBC AI Lab. Powered by an advanced deep-learning framework and trained with a huge volume of daily market data, A.I. Oscar is designed to support more informed trading decisions.

    HOW A.I. OSCAR CAN ASSIST YOU

    A.I. Oscar identifies stocks with potential short-term market movements from SG, US and HK using these key indicators:

    Vast Market Data
    Predicting possible future market shifts and trends by analysing vast amounts of market data from reputable partners such as LSEG Data & Analytics, Nasdaq, and major stock exchanges.

    Technical and fundamental indicators
    Evaluating potential market movements using important technical and fundamental indicators.

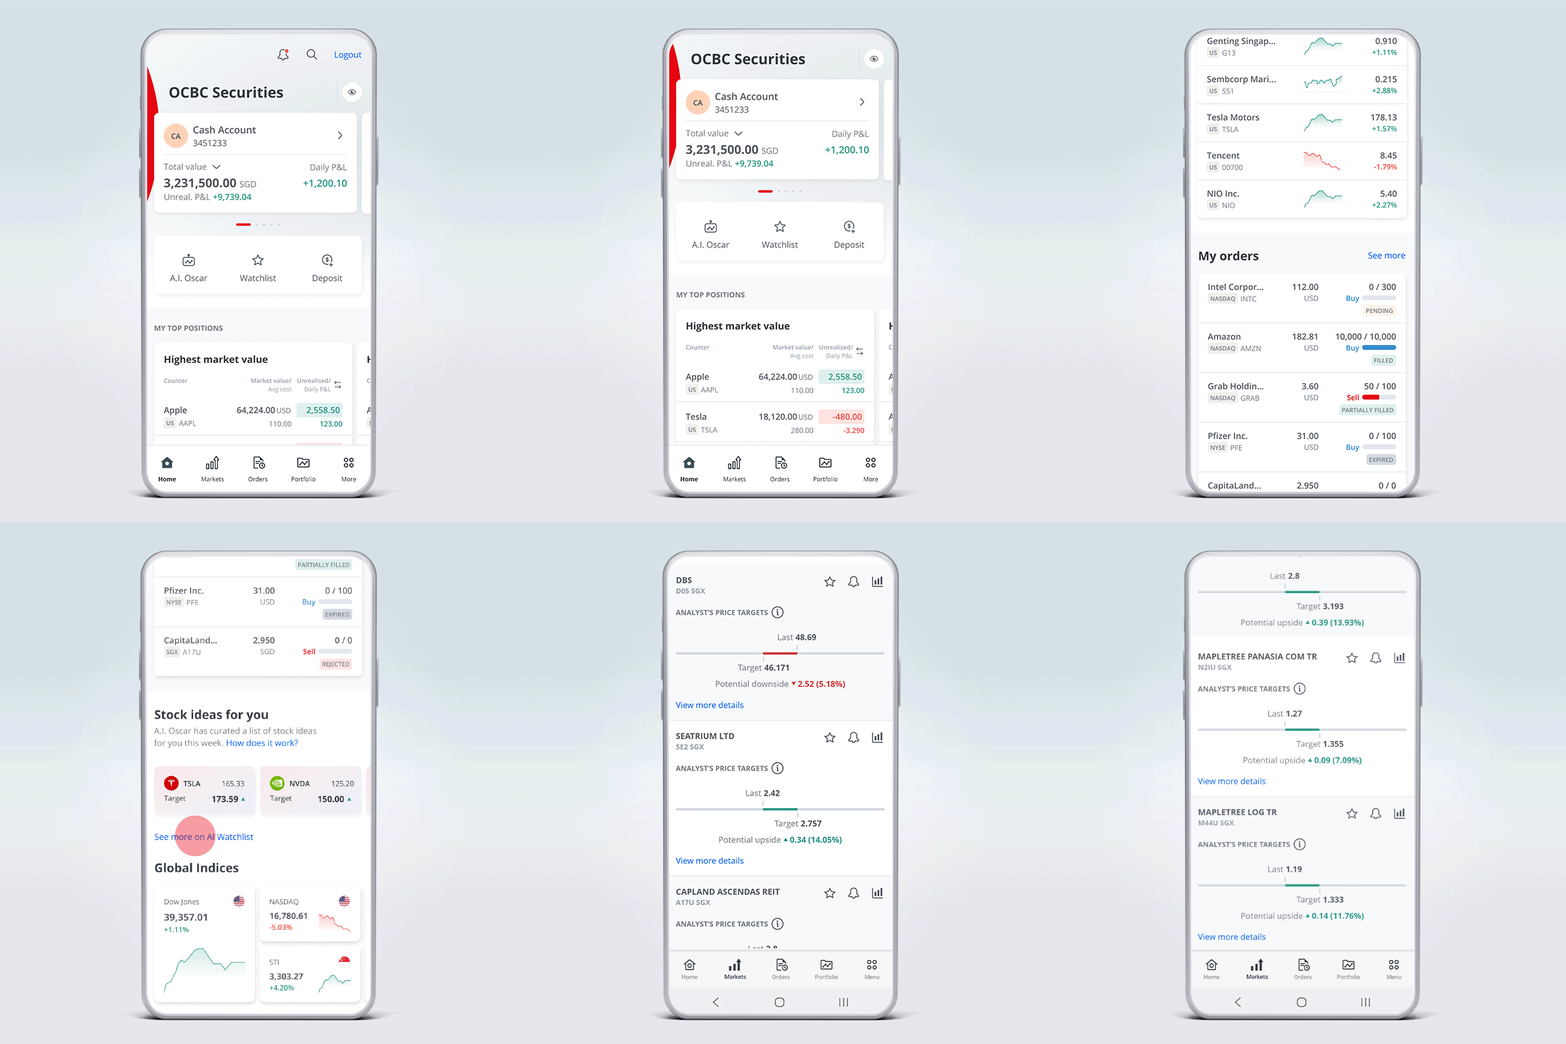
    A.I. Oscar combines all these indicators to provide you with your very own personalised stock ideas based on your trading history with us. You can choose to add these ideas to your watchlist and track their performance over time, empowering you with more confidence when you make your next trading move. These ideas can be accessed via your A.I. watchlist when you log in to the iOCBC trading platform.

    Where to find A.I. Oscar on the iOCBC Mobile app

    1. Open the iOCBC Mobile App: Launch the app on your smartphone.
    2. Navigate to the Markets Section: Tap on the “Markets" tab located on the bottom navigation bar.
    3. Select Watchlist: Tap on Watchlist > AI watchlist to get your own list of personalised stock ideas based on your trading history with us!

    Learn more

    You can also access A.I. Oscar on the iOCBC trading platform via your browser.

    This image is for illustration purposes only and does not constitute a recommendation to buy or sell any capital markets products.

    WHAT OTHERS SAY ABOUT A.I. OSCAR

    A.I. Oscar has been highlighted in leading publications, underscoring its innovation and impact. Read on and discover how it is shaping smarter, more informed trading decisions.

    The future of investing smarter, more informed trading with OCBC Securities.

    The future of investing: Making more informed decisions with an AI-powered virtual trading assistant.

    OCBC Securities offers premier banking upgrades under share transfer scheme.

    By clicking the articles, you will be redirected to an external website . Please note that OCBC Securities does not endorse or take responsibility for the content, accuracy, or security of such external websites.

    Important notes

    Disclaimer

    Trading in capital markets products and borrowing to finance transactions (including, but not limited to leveraged trading or gearing) can be very risky, and you may lose all or more than the amount invested or deposited. Where necessary, please seek advice from an independent financial adviser regarding the suitability of any trade or capital markets product, taking into account your investment objectives, financial situation, or particular needs before making a commitment to trade or purchase the capital markets product. In the event that you choose not to seek advice from a financial adviser, you should consider whether the capital markets product is suitable for you. You should carefully consider and exercise caution in making any trading decision whether or not you have received advice from any financial adviser.

    The information provided herein does not take into consideration your investment objectives, financial situation, and particular needs. Any reference to a company, financial product or asset class is not meant as a recommendation. Where any graph, chart, formula or device is included, there may be limitations and difficulties in respect of its use. Where any historical information is included, past performance is not necessarily indicative of future performance. OCBC Securities Private Limited (“OCBC Securities”) makes no representations or warranties (including as to the accuracy, timeliness or adequacy) in respect of any information provided herein or in your personalised AI watchlist, and it should not be relied upon as such. Such information should not be construed as personal trading recommendations or financial advisory in any manner from OCBC Securities. OCBC Securities does not undertake any obligation to update the information or to correct any inaccuracy that may become apparent at a later time. OCBC Securities shall not be responsible for any loss or damage howsoever arising, directly or indirectly, as a result of any person acting on any information provided herein.

    The information provided herein is intended for general circulation and/or discussion purposes only and may not be published or circulated in whole or in part without our prior consent.


    get started with iocbc trading

    Start trading and get access to stock ideas tailored just for you

    yet to download the app?

    Search for "iOCBC Mobile Trading Platform" on the official app stores.

    Google Play

    For Android users

    Apple Store

    For iOS users

    OUR AWARDS AND ACCOLADES
    glossary

    Definition of the terms

    Check out this quick glossary for clear explanations of key trading terms.

    Market Cap

    Market Capitalisation refers to the total dollar market value of a company’s outstanding shares of stock.

    52 Week High

    52 Week High measures the highest stock prices within the last 52 weeks or one year.

    52 Week Low

    52 Week Low measures the lowest stock prices within the last 52 weeks or one year.

    Next Earnings

    This refers to the date of the official public statement of a company's profitability for a specific period, typically a quarter or a year.

    Price/Earning Ratio

    The Price/Earning (P/E) ratio reflects the relationship between a company’s stock price and its earnings. It indicates how much investors are willing to pay for each dollar of the company’s earnings.

    Price/Book Ratio

    The price/book (P/B) ratio is a valuation metric that compares a company's share price to its book value. It is used to determine whether a company is undervalued or overvalued.

    WTD

    Week-To-Date (WTD) return refers to the amount of profit made by an investment since the first day of the current week.

    MTD

    Year-To-Date (YTD) return refers to the amount of profit made by an investment since the first day of the current month.

    YTD

    Year-To-Date (YTD) return refers to the amount of profit made by an investment since the first day of the current year.

    Div Yield (%)

    The dividend yield, which is expressed in percentage, is a financial ratio (dividend/price) that shows how much a company pays out in dividends each year relative to its stock price.

    New to trading? We have a series of back to basic videos catered to help you understand and be equipped with the fundamental knowledge on trading. Start your lesson today!

    Online application using Myinfo*

    For individual customers who are 21 years and above.

    Please prepare a digital copy/picture of your signature to be uploaded (in JPG or PNG, less than 2MB)

    or

    Offline and corporate application at a branch or via mail

    For individual customers who are 18 to 20 years old, foreigners who do not have Myinfo and corporate customers.